10 Best Code Coverage Tools Compared in 2026
Choose a language-native collector first, then add the reporting and governance layer your team actually needs.
Code coverage tools measure which parts of a codebase execute while automated tests run. They can reveal untested lines, branches, functions, or statements, but the tools do not all perform the same job.
Some tools collect coverage inside one language ecosystem. Others receive those reports, compare a pull request with its base branch, display trends, or enforce a team policy. Treating both layers as interchangeable leads to the wrong shortlist.
The best code coverage setup in 2026 starts with a collector that fits your language and test runner. Add a reporting platform only when you need pull request feedback, cross-repository visibility, or centralized governance. For example, a Java team may collect coverage with JaCoCo and report it through Codecov, GitHub, or SonarQube.
This guide compares ten current code coverage tools, explains which layer each one belongs to, and shows how to choose without turning one percentage into a false measure of test quality.
Quick Picks by Use Case
These are editorial recommendations based on documented fit, not benchmark winners:
- Multi-language pull request reporting: Codecov
- GitHub-native line coverage: GitHub Code Quality
- Coverage inside broader quality governance: SonarQube
- Java and JVM collection: JaCoCo
- JavaScript and TypeScript collection: Istanbul,
nyc, or the coverage provider built into the test runner - Python collection: Coverage.py
- Open-source .NET collection: Coverlet
- C and C++ with GCC coverage data: gcovr
- Ruby and Rails collection: SimpleCov
dotCover fits .NET teams that already use JetBrains tools or need detailed IDE analysis. A built-in option such as go test -cover, LLVM coverage, or Xcode coverage may be enough when it measures the target runtime and produces the required reports.
Code Coverage Tools Compared
| Tool | Type | Best for | Languages | Main tradeoff |
|---|---|---|---|---|
| Codecov | Reporting platform | Multi-language pull request feedback | Accepts reports from many ecosystems | Requires an external service and a separate collector |
| GitHub Code Quality | Repository reporting | GitHub-native line coverage on pull requests | Any language that produces Cobertura XML | Paid Code Quality product that reports line coverage only |
| SonarQube | Quality platform | Coverage within broader quality governance | Imports reports for many languages | Requires scanner and report configuration and is broader than coverage alone |
| JaCoCo | Coverage collector | Java and JVM projects | Java bytecode | JVM-focused and needs another layer for cross-repository reporting |
| Istanbul and nyc | Coverage collector | JavaScript and TypeScript | JavaScript and instrumented TypeScript output | Reporting across repositories usually requires another service |
| Coverage.py | Coverage collector | Python projects | Python | Python-only and needs CI integration for shared review workflows |
| Coverlet | Coverage collector | Open-source .NET coverage | .NET and C# | Focused on collection rather than team dashboards |
| dotCover | Collector and local analysis | JetBrains and advanced .NET workflows | .NET | IDE integration is commercial, while the command-line package is free and .NET-specific |
| gcovr | Coverage processing | C and C++ projects using GCC coverage data | C and C++ | Depends on compatible compiler instrumentation and configuration |
| SimpleCov | Coverage collector and reporter | Ruby and Rails projects | Ruby | Ruby-only and must start before application code loads |
There is no universal first-place tool in this table. A hosted reporting platform and a language-specific collector solve different problems. The useful comparison is whether a tool fits the layer, language, repository host, and evidence your team needs.
How We Selected the Tools
This is a source-based editorial comparison, not a hands-on performance benchmark. We reviewed the linked official documentation on August 30, 2026, and included tools that directly satisfy at least one of two jobs:
- Collect coverage data. The tool observes instrumented code while tests run and reports what executed.
- Turn coverage into team feedback. The tool imports coverage reports, compares changes, presents results in pull requests, tracks trends, or applies policy.
We favored actively documented tools with a clear language, pull request, or governance use case. We did not rank products by vendor popularity, unverified adoption numbers, or a single feature checklist. Confirm current pricing and availability before standardizing a workflow.
We excluded test-generation products, test-management systems, GUI automation suites, security platforms without a primary coverage workflow, and CI services that only store an artifact. We also did not rank every compiler, IDE, test-runner integration, report format, or language-specific alternative. Those options may be the correct local choice, but a longer inventory would make the comparison less useful.
What Coverage Tools Measure
Coverage is execution evidence. The common metrics answer related but different questions:
- Line coverage: Did each executable line run?
- Statement coverage: Did each executable statement run?
- Branch coverage: Did tests take each outcome of a decision?
- Function or method coverage: Did tests invoke each function or method?
- Condition coverage: Did the boolean parts of a compound decision evaluate both ways?
A high line percentage can still hide an untested branch. A test may execute a line without asserting the result that matters. Generated files, unreachable defensive code, and platform-specific paths can also distort the denominator.
This is why a useful coverage policy names the metric, scope, exclusions, and baseline. Saying “we require 80 percent coverage” is incomplete unless the team knows whether that means lines or branches, the entire repository or changed code, and which files are excluded.
Collectors and Reporting Platforms
A collector runs with the test suite. It instruments source code, bytecode, or compiled output and records what executes. JaCoCo, Istanbul, Coverage.py, Coverlet, dotCover, gcovr, and SimpleCov belong primarily to this layer.
A reporting platform receives the collector’s output. It can compare the pull request branch with the default branch, annotate changed files, retain history, or enforce thresholds. Codecov, GitHub Code Quality, and SonarQube belong primarily to this layer. SonarQube documentation is explicit that teams configure a coverage tool first, then configure SonarScanner to import its report.
Many practical setups therefore use two tools, not one:
tests -> language collector -> coverage report -> PR or governance platformBefore buying or installing anything, check whether your test runner already includes a suitable collector. Jest and Vitest can produce JavaScript coverage, go test has built-in coverage support, and several IDEs can display local results. A second tool should improve a real team decision, not duplicate a report that nobody reads.
1. Codecov
Codecov is a hosted reporting platform that accepts coverage output from many languages and test frameworks. Its pull request comments can show overall change, diff coverage, flags, and affected files without requiring reviewers to leave the code host.
Codecov is useful when a team has several languages, repositories, or parallel test jobs and wants one coverage workflow above them. Flags can separate components or test suites, while merged reports can represent a larger build.
Best for: Multi-language teams that want coverage changes visible during pull request review.
Consider: Codecov does not replace the collector. The test workflow still needs to generate and upload accurate reports. Teams must also review token handling, permissions, retention, and plan limits before sending repository data to a hosted service.
2. GitHub Code Quality
GitHub Code Quality now provides built-in code coverage for supported GitHub Team and Enterprise Cloud repositories. The official setup accepts Cobertura XML and displays line coverage on pull requests, including branch-to-default comparisons and per-file changes.
This is a meaningful change from older workflows that required a third-party action, a custom pull request comment, or a downloadable artifact. GitHub also documents automatic setup that can propose the workflow through a pull request, although teams should still inspect the generated configuration and report mapping.
Best for: Teams that keep code and pull requests in GitHub and want a native line-coverage workflow.
Consider: GitHub’s current coverage view uses line coverage, even when the uploaded report contains branch or function metrics. It also requires a collector that can produce or convert to Cobertura XML. Code Quality became a paid, generally available product for GitHub Team and Enterprise Cloud in July 2026, so include licensing and usage costs in the decision.
3. SonarQube
SonarQube Server and SonarQube Cloud place coverage beside static-analysis findings and other quality measures. SonarQube imports reports produced earlier in the build rather than generating coverage for every language itself.
Its value is governance. Teams can define quality gates, focus conditions on new code, and expose the result in pull requests and CI. That is useful when coverage is one part of a broader engineering policy rather than a standalone dashboard.
Best for: Organizations that want coverage integrated with centralized code-quality policy.
Consider: The setup includes both the language collector and SonarScanner configuration. A quality gate can also become noisy or counterproductive when one threshold is applied to unlike repositories. Calibrate policies against the code and risk model instead of adopting a default number without review.
4. JaCoCo
JaCoCo is an open-source coverage library for Java bytecode. It reports instruction, branch, line, method, class, and complexity counters, and integrates with common Java build workflows.
JaCoCo is usually the natural collector for Java projects because it works close to the JVM execution model and can produce reports for local inspection or downstream systems. Its documentation also explains an important limitation: bytecode instrumentation does not map every Java language construct back to source in an intuitive way, especially when the compiler produces synthetic code.
Best for: Java projects that need a mature language-native collector.
Consider: JaCoCo is not a cross-repository reporting platform. Use its local reports directly or send the output to a compatible CI, pull request, or governance layer. Verify format conversion carefully because not every consumer interprets JaCoCo XML in the same way.
5. Istanbul and nyc
Istanbul instruments JavaScript and records statement, branch, function, and line coverage. The nyc command-line interface makes Istanbul coverage available to Node.js test workflows and can emit formats such as text, HTML, LCOV, and Cobertura through its reporters.
JavaScript teams may already use Istanbul indirectly through Jest or another test runner. In that case, adding nyc separately may be unnecessary. Check which provider instruments the code, how source maps connect transformed TypeScript to the original files, and whether browser and server tests are merged correctly.
Best for: JavaScript and TypeScript projects that need flexible local and CI coverage output.
Consider: Transpilation, source maps, subprocesses, browser execution, and mixed test runners can create surprising gaps or duplication. Validate a few known branches before trusting the aggregate percentage.
6. Coverage.py
Coverage.py measures Python execution and can produce text, HTML, XML, LCOV, and JSON reports. It works with common Python test workflows and supports branch measurement in addition to the default statement-oriented view.
Coverage.py is a strong default because it stays close to the language ecosystem while still producing formats that hosted reporting platforms can consume. Teams using pytest often access it through pytest-cov, which coordinates coverage collection with the test runner.
Best for: Python projects that need dependable local reports and portable CI output.
Consider: Concurrency, subprocesses, dynamic imports, and omitted files need deliberate configuration. An HTML report is excellent for local investigation, but a team still needs a publishing or pull request layer if the result must become part of shared review.
7. Coverlet
Coverlet is an open-source, cross-platform coverage framework for .NET. Microsoft documents it as a collector for dotnet test, with output that can be converted into human-readable reports or uploaded to CI systems.
Coverlet fits projects that want coverage in the normal .NET test workflow without adopting a commercial desktop tool. It can generate common machine-readable formats and works with test frameworks such as xUnit, MSTest, and NUnit through the .NET test infrastructure.
Best for: .NET teams that want an open-source collector in local and CI test runs.
Consider: Coverlet focuses on collecting and exporting coverage. Use a report generator or hosted platform for richer browsing, pull request history, and organization-level policy.
8. dotCover
JetBrains dotCover provides .NET coverage analysis in JetBrains workflows and through a cross-platform command-line tool. It can run coverage with common .NET test runners, merge snapshots, and generate XML or JSON reports.
dotCover is useful when developers want detailed local analysis inside Rider or Visual Studio and the team wants the same collector available in CI. The command-line tool can run on Windows, Linux, and macOS with a compatible .NET runtime.
Best for: .NET teams already using JetBrains tools or needing both IDE and command-line analysis.
Consider: The IDE-integrated product requires a license, while JetBrains distributes the command-line tools as a free package under a separate license. Both remain .NET-specific. Review current runtime support and filtering behavior before adopting either workflow.
9. gcovr
gcovr processes coverage data produced by GCC’s gcov instrumentation and creates summarized reports for C and C++ projects. It can emit human-readable HTML and text as well as machine-readable formats including Cobertura, LCOV, JaCoCo, SonarQube, and Coveralls output.
That breadth makes gcovr useful as a bridge between compiler coverage and the reporting platform selected by the team. It also supports filters and exclusion markers needed to keep generated, vendor, and test harness code from distorting a project report.
Best for: C and C++ projects using GCC-compatible coverage data.
Consider: Compiler flags, optimization, build directories, path mapping, and toolchain versions affect the result. Reproduce the CI configuration locally before treating a missing file as an untested file.
10. SimpleCov
SimpleCov builds on Ruby’s coverage library and adds configuration, filtering, grouping, merging, thresholds, and reports. Line coverage is enabled by default, with branch and method coverage available when configured.
SimpleCov works with common Ruby test suites and includes an HTML report for local inspection. It can combine results from multiple test processes, which matters when a suite runs unit, request, and browser tests separately.
Best for: Ruby and Rails projects that want a mature ecosystem-native workflow.
Consider: SimpleCov must start before application code loads or it cannot observe those files. Process boundaries and preloaded development tools can also affect collection, so validate the setup before enforcing a threshold.
How to Choose Your Stack
Start with the language collector. If it does not measure your runtime correctly, no dashboard can repair the evidence later.
Then ask whether the team needs a second layer:
- Local feedback only: Use the collector’s terminal or HTML report.
- Pull request feedback: Add Codecov, GitHub Code Quality, or another reporting integration that supports your report format.
- Broader quality governance: Use SonarQube when coverage belongs beside static analysis and shared quality policy.
- Several languages in one repository: Collect coverage per ecosystem, then choose a reporting layer that can merge or separate the results without hiding their different metrics.
- Regulated or safety-critical software: Confirm the required coverage criteria, traceability, tool qualification, and audit evidence. A general-purpose line coverage dashboard may not satisfy those requirements.
Also evaluate operational cost. Coverage can slow test runs, expand CI storage, expose source paths to third-party services, and create noisy pull request comments. Pilot the complete workflow on a representative repository before rolling it across an organization.
Set Thresholds Without Gaming Them
Coverage thresholds are useful when they prevent unexplained loss. They become harmful when developers optimize the percentage instead of the tests. Google’s code coverage guidance describes coverage as a useful but lossy and indirect metric that should not become the only source of truth.
A practical policy often focuses on changed code while preserving a repository baseline. That makes new work visible without demanding an immediate rewrite of every historical gap. However, changed-code coverage can still be gamed with shallow assertions, broad integration tests, or exclusions that remove difficult files from the denominator.
Review these questions with the number:
- Did branch coverage fall even though line coverage stayed flat?
- Are important error paths and state transitions exercised?
- Do assertions verify observable behavior rather than implementation details?
- Are exclusions narrow, documented, and reviewed?
- Did a test fail when a known behavior was intentionally broken?
- Does the report include all relevant processes, packages, and test levels?
One hundred percent coverage is not a universal goal. Some code is generated, platform-specific, defensive, or better verified at another test level. The useful target is credible protection of important behavior, not a perfect dashboard.
Coverage Is Not Release Verification
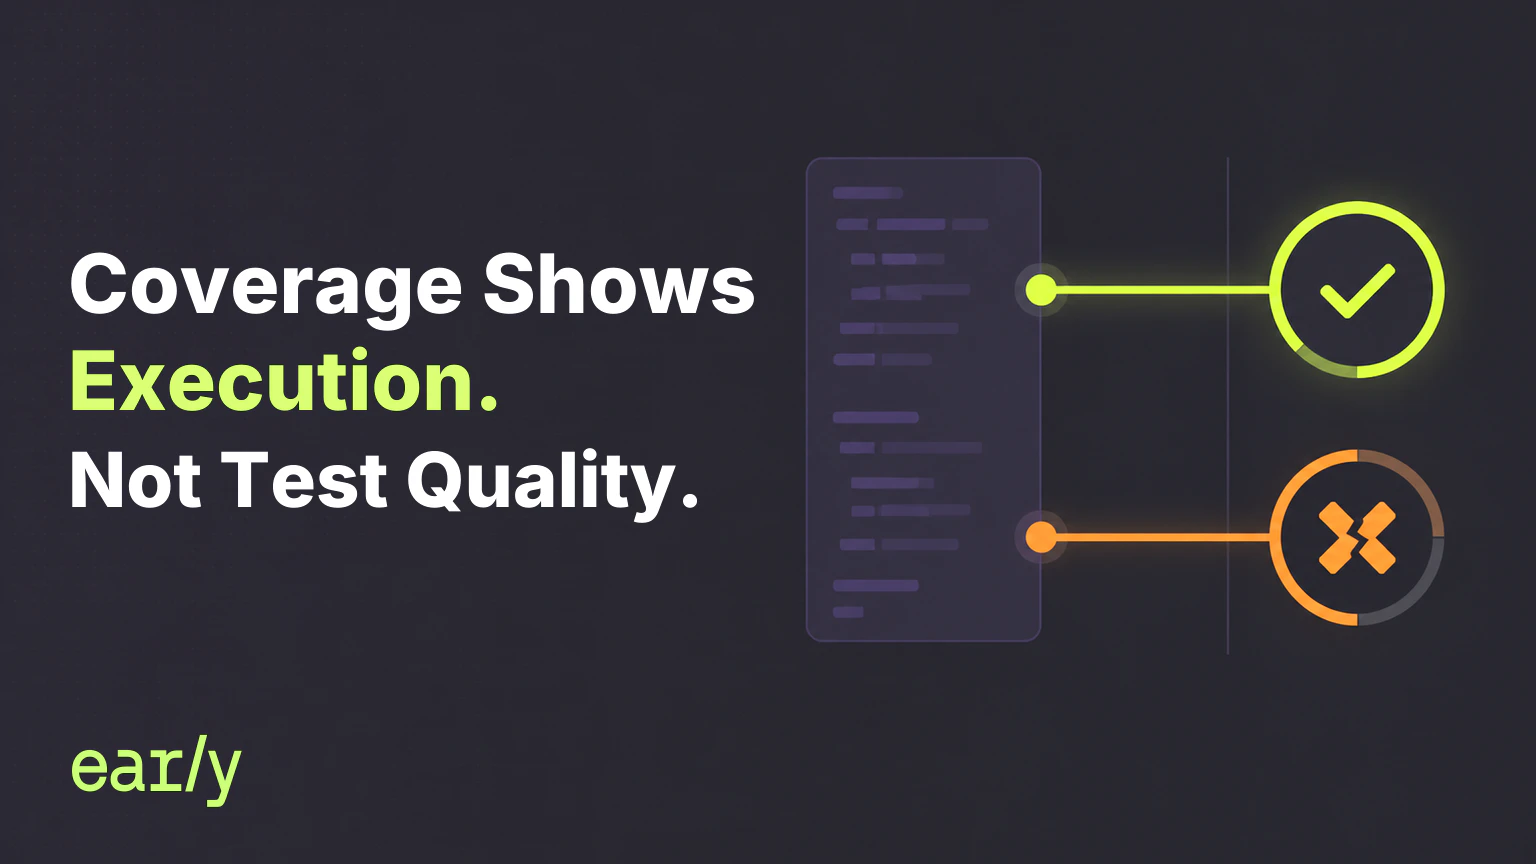
Code coverage answers whether instrumented code executed during a test run. It does not prove that the assertions were meaningful, that the requirements were correct, or that every affected behavior remained stable after a change.
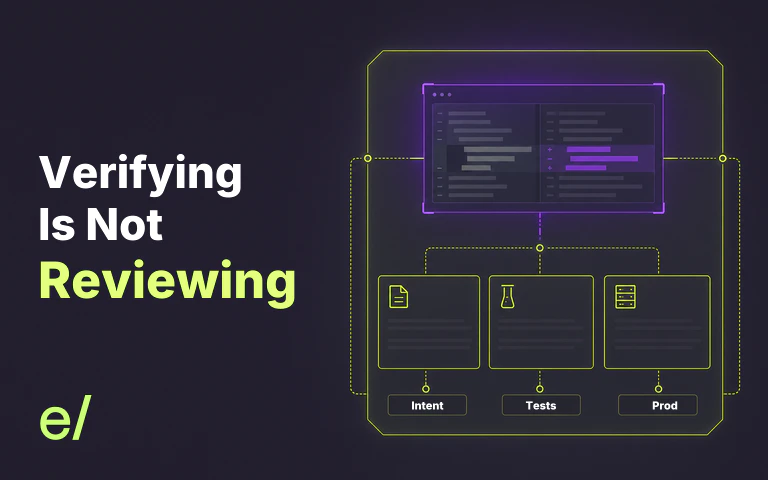
Release verification asks a wider question: what behavior could this release affect, and what evidence shows that the intended behavior still holds? Coverage contributes to that evidence, but it cannot answer the question alone. Teams still need test results, change review, operational context, and verification of important behavior across changed and dependent components.
This boundary becomes more important as coding agents produce larger changes. A generated test can raise coverage while preserving an incorrect assumption. Verifying AI-generated code therefore requires more than reading the diff or accepting a percentage.
Frequently Asked Questions
What is the best code coverage tool?
The best tool depends on the language and workflow. Start with JaCoCo for Java, Istanbul or a test-runner integration for JavaScript and TypeScript, Coverage.py for Python, Coverlet for open-source .NET workflows, gcovr for GCC-based C and C++, or SimpleCov for Ruby. Add a reporting platform when the team needs shared pull request feedback or governance.
Collector or reporting platform?
A collector observes execution and creates coverage data. A reporting platform imports that data and turns it into comparisons, history, and policy. Many teams need one of each. Buying a reporting platform does not remove the need for correct language instrumentation.
Does full coverage prove test quality?
No. Full line coverage means every counted line executed. It does not show that every branch ran, that assertions would catch incorrect behavior, or that the suite represents the product’s important scenarios.
Should coverage block a pull request?
It can, but the rule should be calibrated. A sudden drop or an untested critical change deserves attention. A universal threshold applied without context can encourage shallow tests and exclusions. Start with visibility, inspect false signals, and enforce only the policy the team can defend.
Choose the Smallest Useful Stack
Most teams do not need ten coverage products. They need one accurate collector for each language and, when the workflow demands it, one place where reviewers can see the result.
Choose the collector first. Validate its output against known covered and uncovered paths. Add a reporting layer only when it changes a real decision in pull requests, CI, or governance. Then treat coverage as one piece of evidence, not the definition of software quality.