Developer Productivity Metrics That Matter in 2026
Measure how engineering effort becomes valuable, reliable product change. Code volume, pull request counts, and AI usage do not prove productivity.
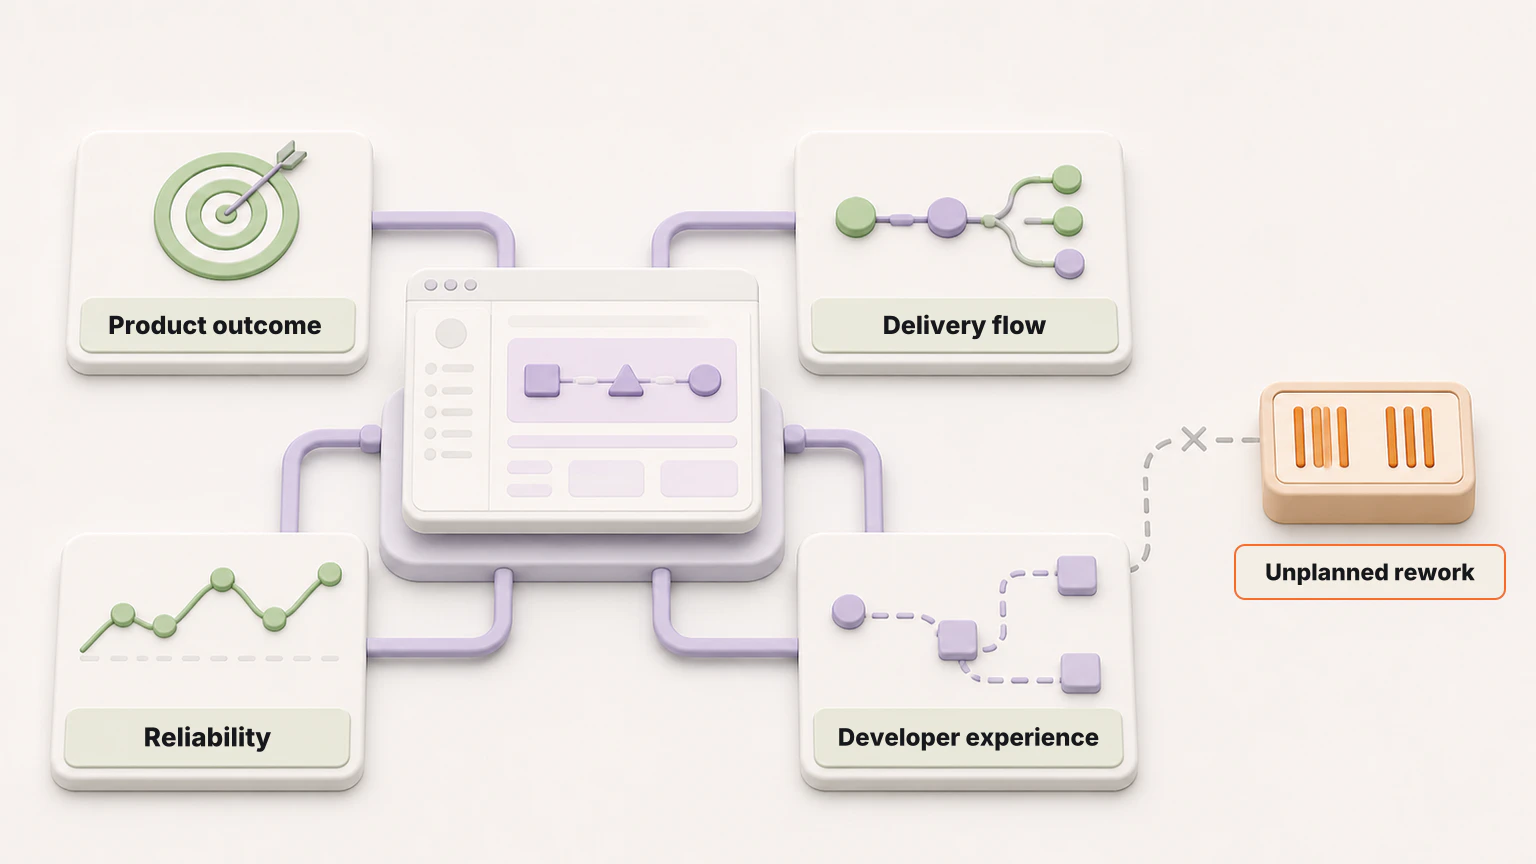
Developer productivity metrics should show whether a team can turn engineering effort into valuable, reliable product change without increasing rework or making the development system harder to use. Lines of code, commit counts, pull request volume, and AI token usage do not answer that question.
No single number does. Software development is collaborative, creative, and constrained by the system around it. A useful measurement model therefore combines product outcomes, delivery flow, quality and reliability, and developer experience. The metrics should help a team find friction and evaluate an improvement. They should not become a leaderboard for individuals.
The practical answer is a balanced scorecard: measure whether the product improved, how smoothly the change reached production, how much failure and rework followed, and whether developers can do the work with fast feedback and manageable cognitive load.
Developer Productivity: Quick Answer
Developer productivity is the ability of an engineering system to produce valuable software outcomes reliably and sustainably. Measure it at the team, application, or service level with counterbalanced signals rather than one output metric.
| Lens | Question | Useful signals | What it prevents |
|---|---|---|---|
| Product outcome | Did the change create value? | Task success, adoption, customer-reported defects | Shipping more work that does not improve the product |
| Delivery flow | Can changes move through the system? | Change lead time, deployment frequency, review and CI wait | Confusing local coding speed with end-to-end delivery |
| Quality and reliability | Did the change hold up after release? | Change fail rate, deployment rework, recovery time, escaped defects | Treating speed and stability as separate goals |
| Developer experience | Can the team work effectively? | Feedback loops, cognitive load, flow, satisfaction | Improving dashboards while making daily work worse |
This model combines DORA delivery metrics, the multidimensional SPACE framework, and the DevEx framework for feedback loops, cognitive load, and flow state.
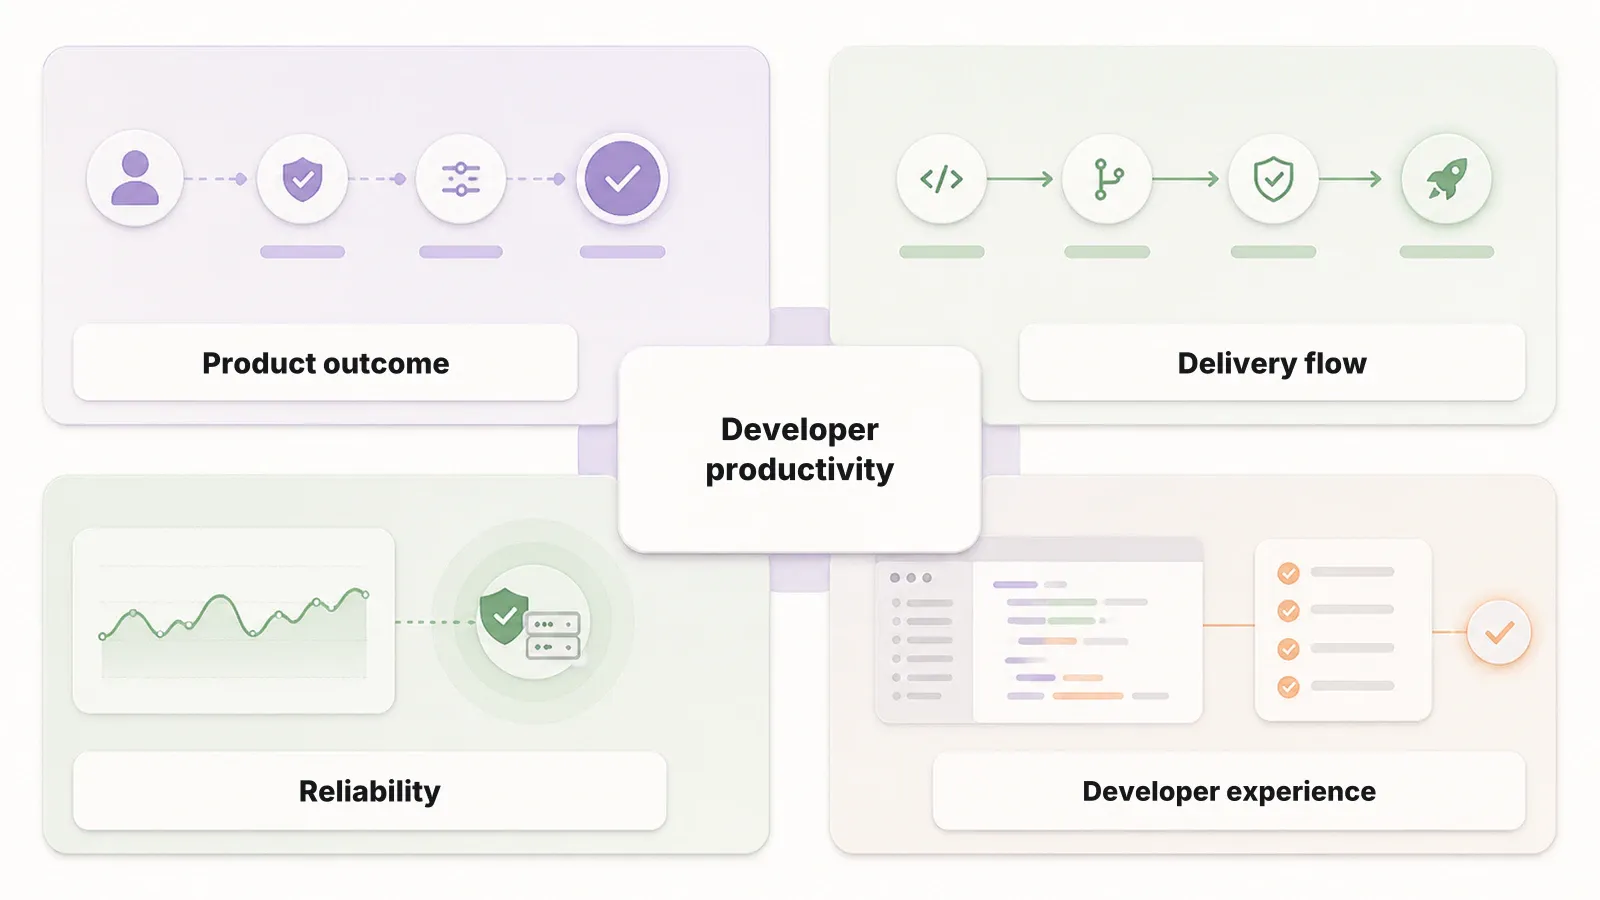
A productivity scorecard needs counterbalanced measures. Improving one dimension should not hide deterioration in another.
Why Output Metrics Fail
Output is easy to count because development tools produce abundant activity data. Productivity is harder because the value of a change depends on what it accomplishes and what happens after it ships.
Ten lines can repair a consequential defect. Ten thousand lines can create complexity that another team must remove. A pull request can merge quickly because it is well scoped, or because review was superficial. A coding agent can complete a large task while shifting more work into validation, correction, and release recovery.
When lines, commits, tickets, or story points become targets, people can improve the number without improving the product. A diagnostic signal becomes the behavior the organization rewards.
DORA makes the same distinction at the delivery level. Its metrics are meant to assess an application or service in context, not to compare unlike systems or rank individual developers. DORA also warns against using one metric as the goal. A team needs tension between throughput and instability so that faster delivery cannot conceal more failed changes.
Ten Metrics Worth Tracking
The following metrics form a practical starting scorecard. Begin with an outcome signal, a balanced view of delivery and reliability, and direct feedback from developers.
1. Product outcome
Product outcome measures whether shipped work improved the user or business result it was intended to change. The exact measure depends on the product: task completion, feature adoption, successful transactions, retention, support volume, or another observable result.
This is the most important lens and often the hardest to attribute. Results may lag a release, so use the metric to connect delivery to value, not to calculate an individual’s contribution.
2. Change lead time
Change lead time measures how long a change takes to move from commit to production. It reveals the combined effect of review, automated checks, approvals, deployment, and waiting.
Track the distribution rather than only the average. A stable median can hide changes waiting days for review or verification. Segment by work type to avoid misleading comparisons.
3. Deployment frequency
Deployment frequency measures how often an application or service is deployed. Frequent, small releases can shorten feedback and reduce the amount of change that must be understood at once.
Frequency is not a target by itself. A team that deploys often while creating more failed changes has not improved the whole system. Read deployment frequency beside change fail rate and deployment rework.
4. Change fail rate
Change fail rate is the share of deployments that require immediate intervention, such as a rollback, hotfix, or urgent remediation. It connects delivery activity to release reliability.
Define a failed change consistently before comparing trends. Use the rate to investigate release conditions and recurring failure modes, not to discourage incident reporting.
5. Deployment rework rate
Deployment rework rate measures unplanned deployments caused by a production incident. DORA now includes it as a distinct instability metric because recovery speed alone does not show how much unplanned corrective work the release system creates.
This metric is particularly useful when coding output rises. A team may merge more changes while spending an increasing share of capacity on hotfixes, reversions, and follow-up corrections. That is more activity, but weaker productivity.
6. Failed deployment recovery time
Failed deployment recovery time measures how long it takes to recover from a deployment that needs immediate intervention. The current DORA model uses this more precise term instead of treating every operational incident as the same kind of recovery event.
Measure from a clearly defined start to a clearly defined restored state. Review severe cases separately. A fast median should not hide one prolonged incident that exposed a critical weakness in ownership, observability, or rollback readiness.
7. Escaped defects
Escaped defects are problems discovered after the relevant change reached users or production. Useful variants include customer-reported defects, incident-causing defects, and defects reopened after an attempted fix.
Raw counts need context. Track severity, affected area, release volume, and recurrence. The useful question is whether the delivery system is reducing consequential failure.
8. Review and CI wait time
Review and CI wait time measures how long work is ready but unable to progress because it is waiting for people or systems. This is a leading indicator of change lead time and a direct view of the team’s feedback loops.
Separate active work from queue time. Waiting for a reviewer or test environment requires a different intervention than asking developers to write code faster.
9. Work in progress age
Work in progress age measures how long active work remains unfinished. Pair it with the number of simultaneous work items and the frequency of unplanned interruptions.
Old work often signals unclear scope, hidden dependencies, overloaded reviewers, or excessive context switching. The goal is not to force every item through at the same speed. It is to expose work that has stopped moving and understand why.
10. Developer experience pulse
A developer experience pulse combines a short recurring survey with workflow evidence. Ask whether feedback arrives quickly, the codebase and tools are understandable, developers can maintain focus, and the team can complete common tasks without unnecessary friction.
System data cannot reveal unclear ownership or an exhausting release process. Keep survey responses aggregated and use trends to prioritize improvements, not evaluate individuals.
How AI Changes Measurement
AI coding agents make output metrics even less reliable. Prompts, tokens, accepted suggestions, generated lines, and agent-completed tasks measure tool activity. They do not establish that the resulting change was valuable, maintainable, correctly reviewed, or ready to release.
The 2025 DORA research describes AI as an amplifier of the surrounding organization. A strong development system can turn faster code creation into shorter lead time and useful product change. A weak one can receive more change than review, testing, and release practices can absorb. Verifying AI-generated code therefore requires evidence about the product impact, not only the proposed change.
Evaluate AI adoption with an end-to-end before-and-after view:
- Compare similar types of work rather than all tasks together.
- Measure lead time and developer experience, not only coding duration.
- Track review effort, deployment rework, change failures, and escaped defects.
- Inspect whether batch size or unfinished work increased.
- Record where saved time moved. It may become product work, verification, correction, or waiting.
An agent can reduce the time required to produce a proposed change while total delivery time stays flat. That is still useful diagnostic information. It means the constraint moved. The response should improve the next bottleneck rather than declare victory based on generated output.
Build a Balanced Scorecard
A developer productivity scorecard should help a team make a decision. Start small and design it around one application, service, or value stream.
- State the outcome. Name the product or operational result the team is trying to improve.
- Choose counterbalanced signals. Pair throughput with reliability, and system data with developer feedback.
- Define every measure. Record the start event, end event, exclusions, unit, and source system.
- Establish a baseline. Observe the current distribution before setting a target or changing the workflow.
- Segment the work. Separate planned features, maintenance, incidents, and major migrations when their paths differ.
- Review trends with context. Ask what changed in the system, not who made the chart move.
- Retire metrics that do not guide action. A dashboard is not valuable merely because it is populated.
Use metrics to find a constraint, make one improvement, and observe the whole scorecard again. If lead time improves but rework rises, the intervention is incomplete. If deployment frequency stays flat while developer feedback improves, the team may have removed friction before the delivery outcome has had time to change.
Metrics to Avoid
Some measures can provide local operational context, but they should not be treated as developer productivity outcomes.
- Lines of code: useful for understanding change size, not value or quality.
- Commit or pull request count: sensitive to task shape and easy to manipulate through smaller units.
- Tickets or story points completed: useful inside one planning system, but not comparable across teams or time without stable definitions.
- Code review comments: can represent careful review, unclear requirements, or avoidable churn.
- AI prompts, tokens, or acceptance rate: measure interaction with a tool, not the result of the work.
- Hours online: measure presence, not problem solving, collaboration, or product impact.
- Individual rankings: turn system signals into surveillance and encourage optimization against the measurement.
These metrics are not always worthless. Change size can help explain review time, and token cost can inform tool economics. The mistake is presenting them as proof that a developer or team became more productive.
Release Reliability Is Productivity
Release reliability belongs inside developer productivity because failures consume the same engineering capacity that creates new value. A fast merge followed by a hotfix, rollback, incident review, and repeated correction is not a completed productivity gain. It is work moved downstream.
Tests and code review provide necessary evidence, but neither automatically describes every product behavior and operational dependency a release can affect. Reviewing the diff is not the hard part when the real question is what the release can break. Escaped defects, change failures, deployment rework, and recovery reveal the cost of learning after production.
This does not make reliability the only goal. A team that never ships can have a low change fail rate. The useful model keeps delivery and reliability together: move valuable changes through the system, then verify that the apparent speed does not return as unplanned work.
Developer Productivity FAQ
What are developer productivity metrics?
Developer productivity metrics are team-level signals that show how effectively engineering effort becomes valuable, reliable product change. A useful scorecard combines product outcomes, delivery flow, quality and reliability, and developer experience instead of relying on one activity metric.
What are the best metrics for developer productivity?
Start with product outcome, change lead time, deployment frequency, change fail rate, deployment rework rate, failed deployment recovery time, escaped defects, review and CI wait time, work in progress age, and a developer experience pulse. Interpret them together and within one application or service.
Are DORA metrics productivity metrics?
DORA metrics measure software delivery performance, not the full concept of developer productivity. They provide strong signals for delivery throughput and instability, but teams should combine them with product outcomes, quality measures, and developer experience.
How should teams measure AI coding productivity?
Measure the end-to-end result rather than prompts, tokens, suggestions, or generated lines. Compare delivery time, review effort, rework, change failures, escaped defects, and developer experience before and after adoption while controlling for work type and system context.
Developer productivity is not the volume of artifacts a team produces. It is the ability to create valuable change, move it through the delivery system, and keep it reliable without making the next change harder. Measure that system, improve its constraint, and let activity remain evidence for diagnosis rather than a score.